
Europe’s riskiest corporate borrowers have pushed their biggest repayments into the next decade, revealed Pitchbook LCD in a research note. Yet defaults are climbing, distressed debt remains high and the weakest corner of the market is expanding fast. The maturity wall has moved; the risk has not.
Defaults return to decade highs
Defaulted debt in the Morningstar European Leveraged Loan Index rose from €839m at the end of the first quarter of 2025 to a 12-year high of €5.7bn in May 2026. It fell in June as Altice dropped out of the rolling calculation, leaving second-quarter volume at €4bn — twice the level a year earlier (see Chart 1).
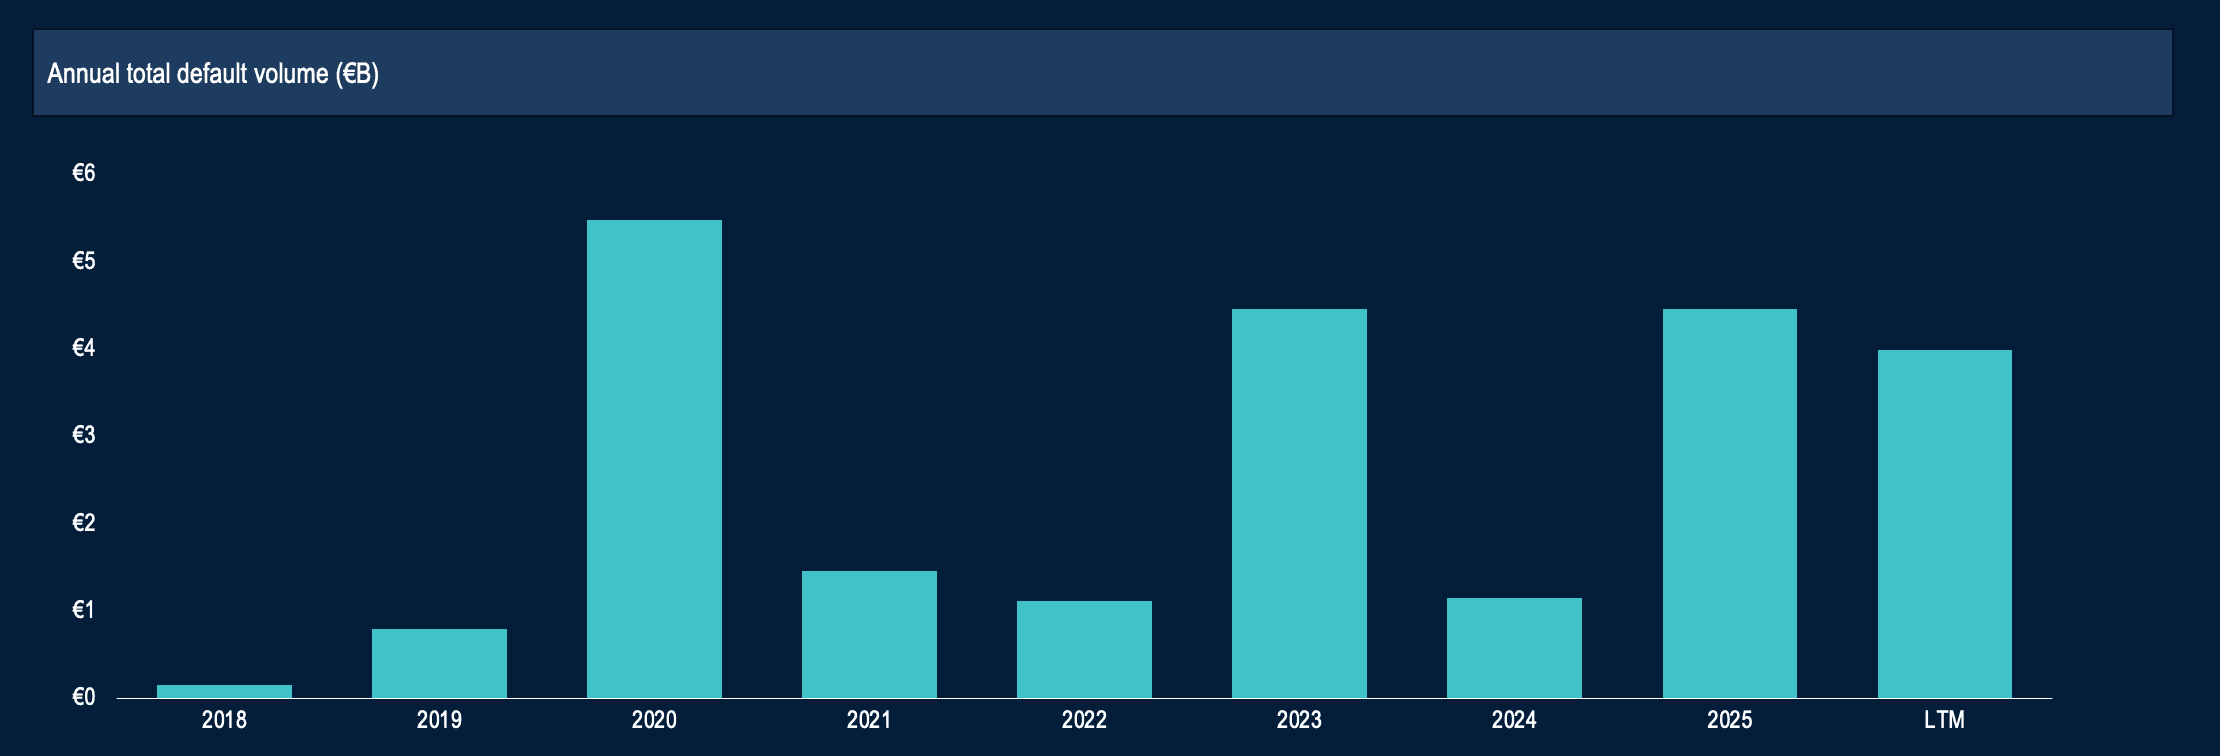
Chart 1: LTM loan default volumes doubled from Q2 2025, reaching €4 billion in Q2 2026. Sources: Pitchbook | LCD; Morningstar European Leveraged Loan Index • Geography: Europe *Data as of June 30, 2026
By issuer count, the 12-month default rate reached 1.47% at the end of June, against 0.61% a year earlier. By outstanding amount, it was 1.23%, up 53 basis points year on year. The figures remain far from crisis territory, but the direction is clear.
Restructurings blur the picture
Missed payments tell only part of the story. Including distressed exchanges and liability management exercises, or LMEs, the combined default rate was 2.06% in the second quarter, easing from 2.33% (see Chart 2). Nearly a third of companies using LMEs are repeat restructurers, suggesting some deals postpone pressure rather than resolve it, according to Pitchbook LCD.
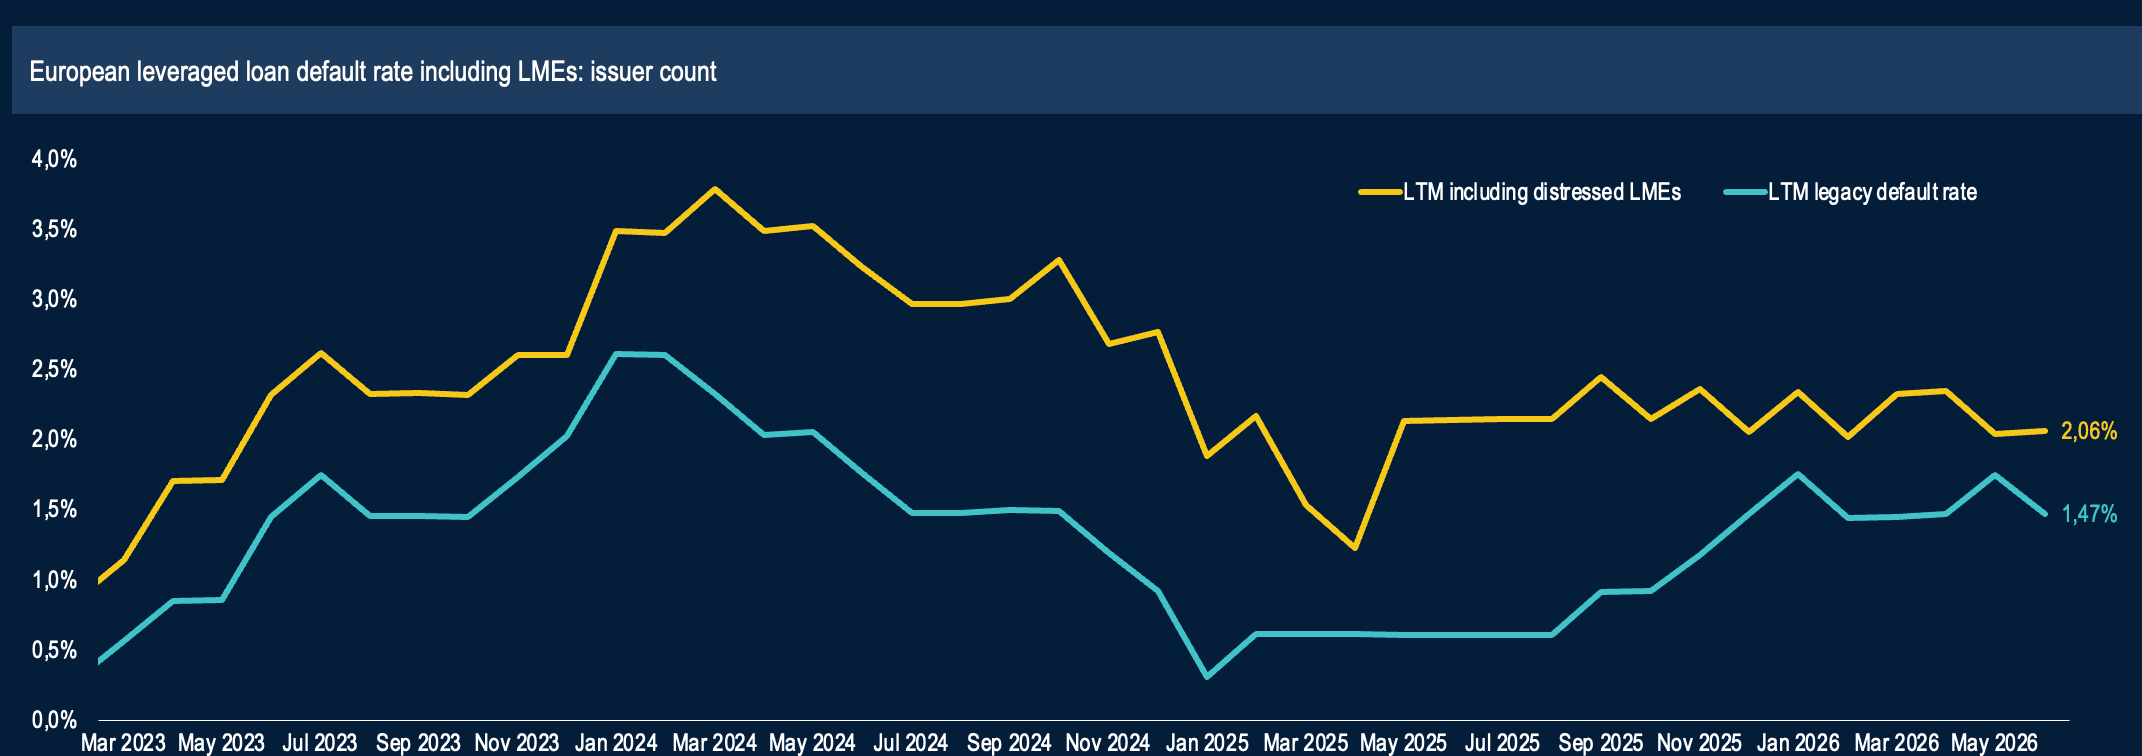
Chart 2: Including liability management exercises, the combined default rate by issuer count stands at 2.06%. Sources: Pitchbook | LCD; Morningstar European Leveraged Loan Index • Geography: Europe *Data as of June 30, 2026
Recent cases show the strain. Payments company Ingenico deferred interest on a €1.1bn senior secured term loan due in March 2030 (see Chart 3). Biscuit Holding extended senior debt and switched its second-lien loan to payment-in-kind interest, prompting a downgrade to Selective Default. Media, healthcare and software companies have been the most active LME users since 2015.
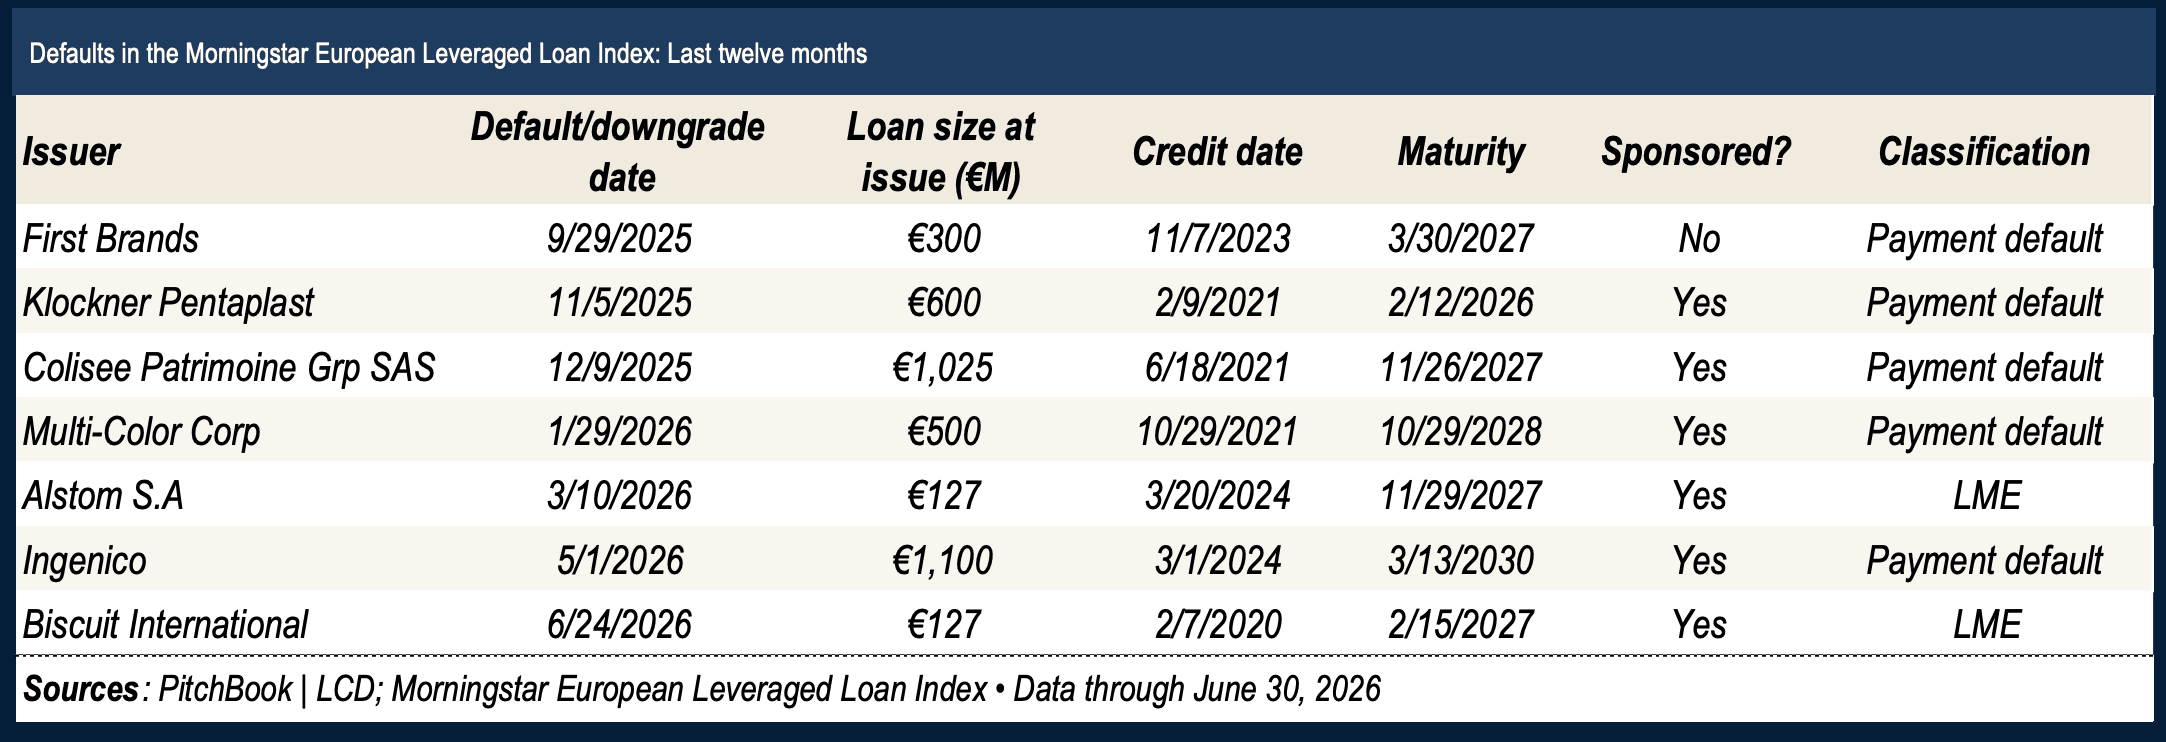
Chart 3: Leveraged loan defaults over 12 months Sources: Pitchbook | LCD; Morningstar European Leveraged Loan Index • Geography: Europe *Data as of June 30, 2026
The weakest debt pile swells
The share of index facilities trading below 80 cents on the euro was 5.76% in June, well above its 10-year average of 3.53%. Ratings momentum is deteriorating too: over the three months to June, downgrades outnumbered upgrades by six to one, compared with five to one in the first quarter and 1.4 to one in June 2024.
Triple-C debt has nearly tripled from €6.7bn in January 2024 to €18.95bn in June 2026, creating more borrowers vulnerable to weak growth, high refinancing costs or an earnings shock (see Chart 4).
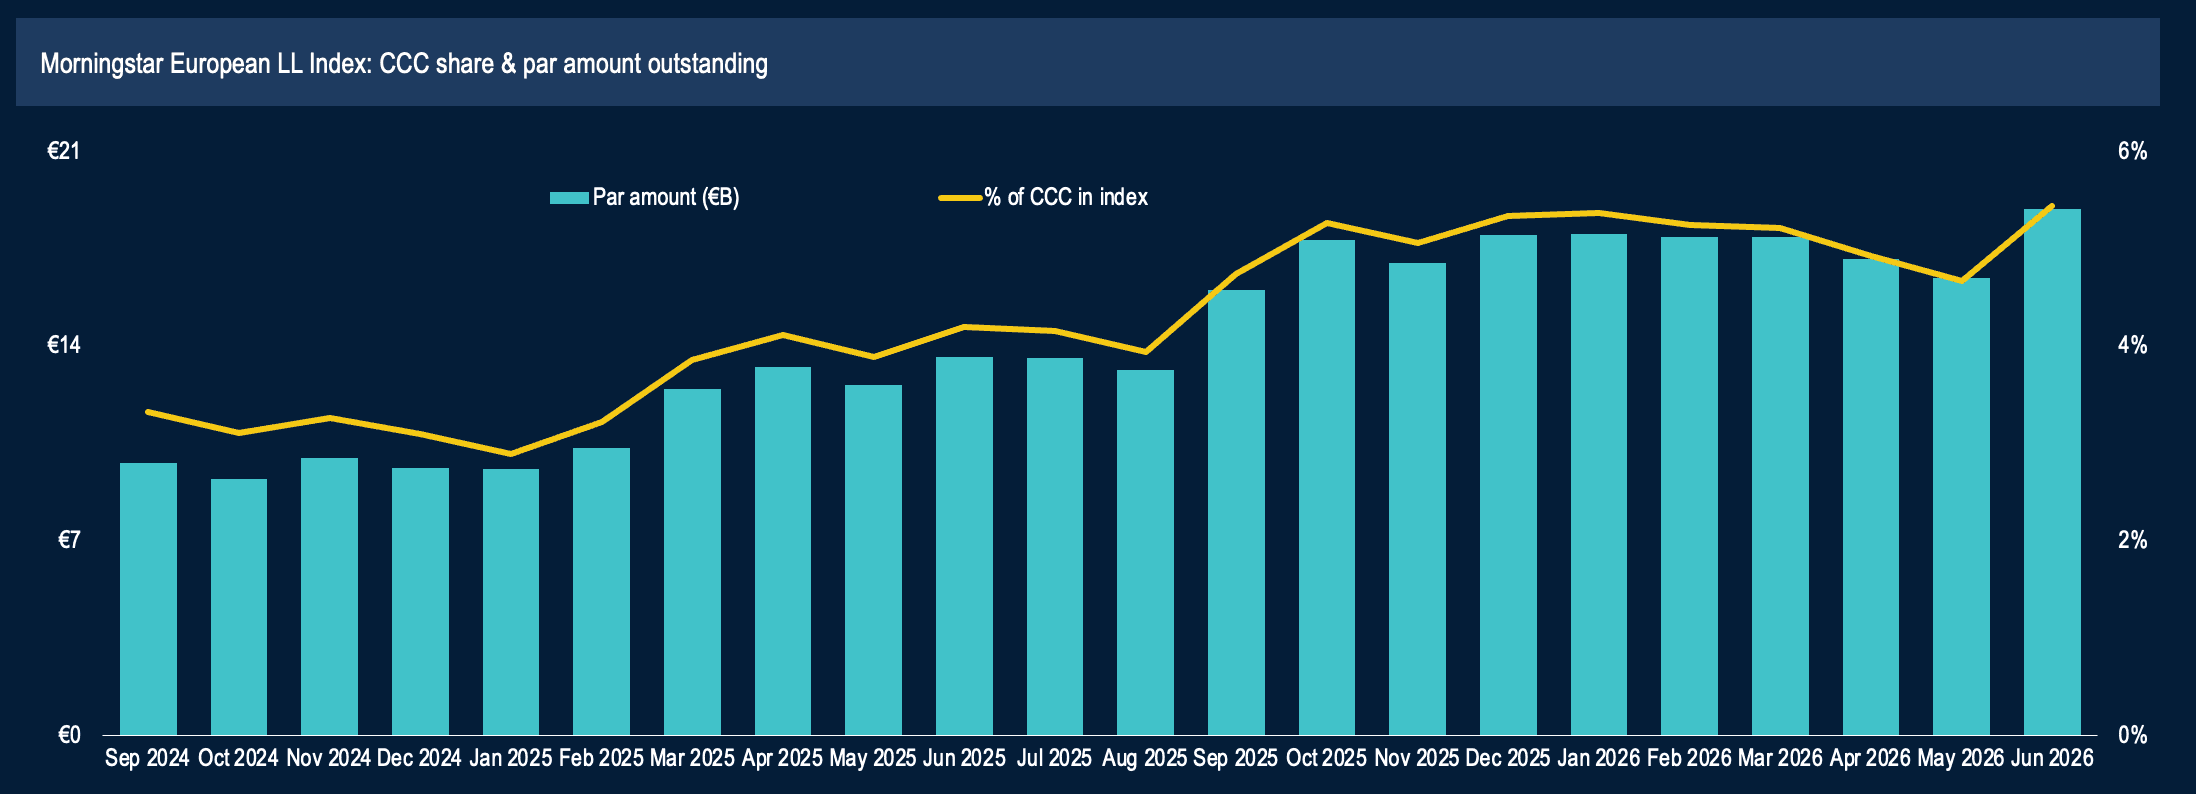
Chart 4: The volume of CCC-rated loans in the ELLI has nearly tripled since January 2024. Sources: Pitchbook | LCD; Morningstar European Leveraged Loan Index • Geography: Europe *Data as of June 30, 2026
Relief now, risk later
Issuers have nevertheless made real progress on maturities, argued the analyst at Pitchbook LCD. Loans due in 2027 shrank to €3.7bn in June from €9bn at the end of 2025, while the 2028 cohort fell to €44.7bn from €70.2bn(see Chart 5). But debt due in 2031 climbed to €98.7bn from €88.1bn.
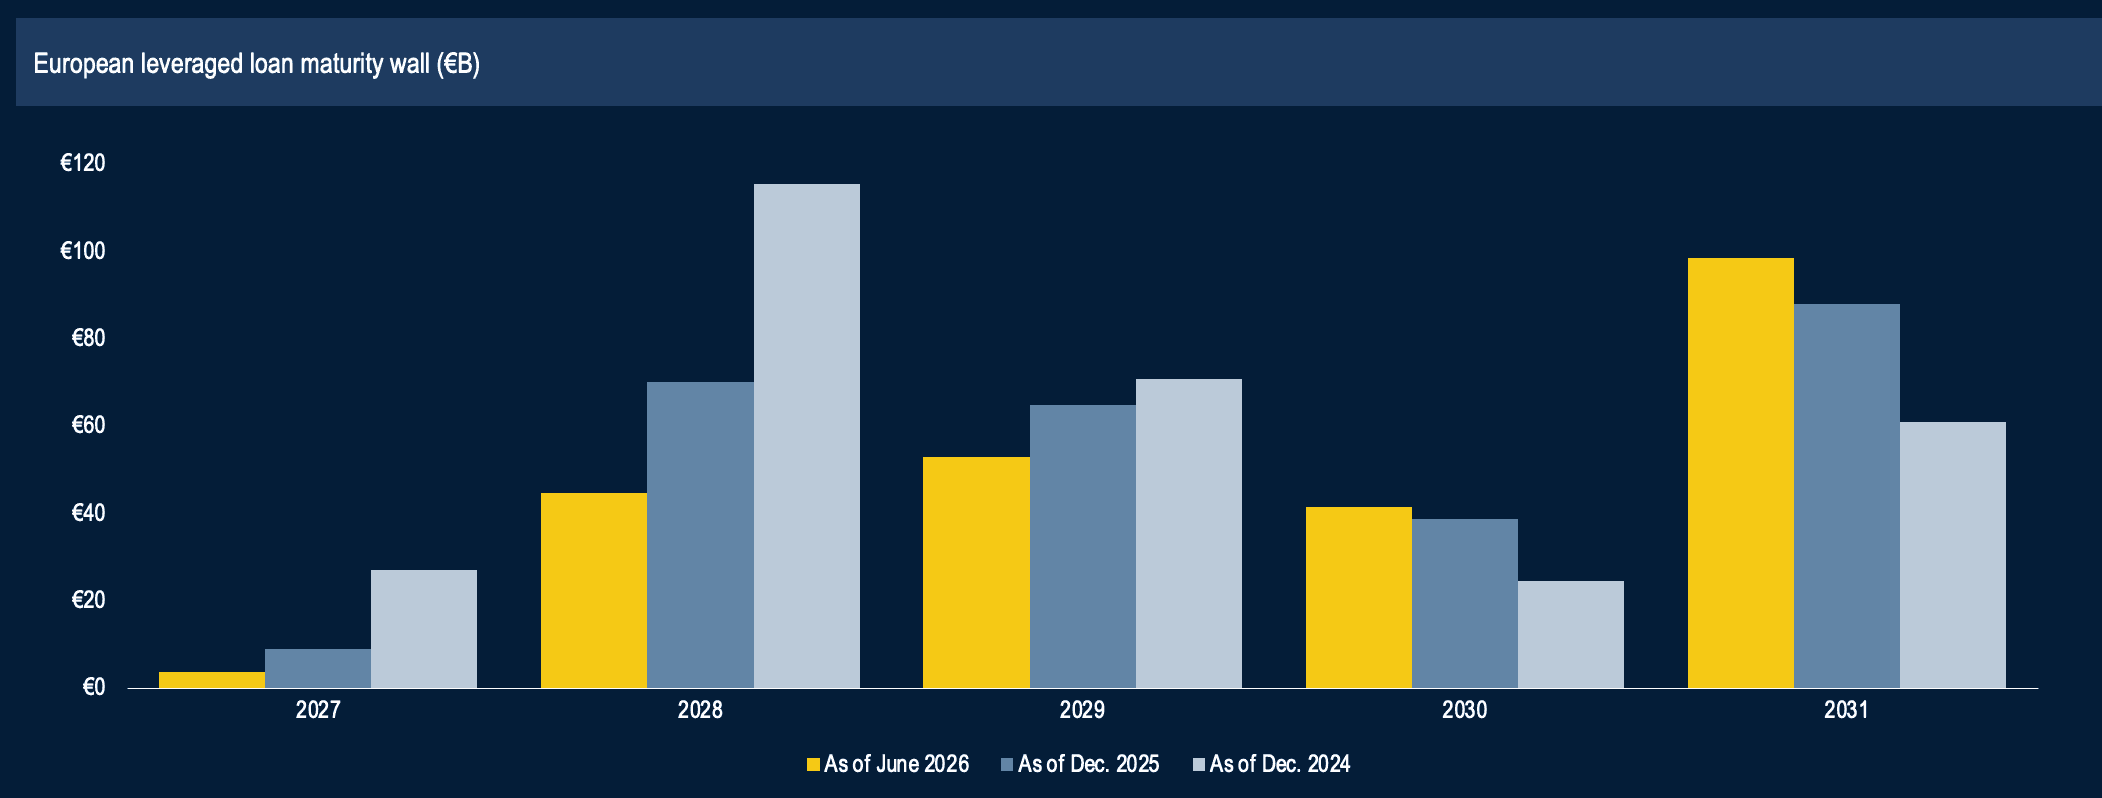
Chart 5: Issuers making significant progress in managing near-term maturities Sources: Pitchbook | LCD; Morningstar European Leveraged Loan Index • Geography: Europe *Data as of June 30, 2026
Europe’s leveraged borrowers have secured time. The test is whether they can use it to repair their balance sheets before the next wall arrives.