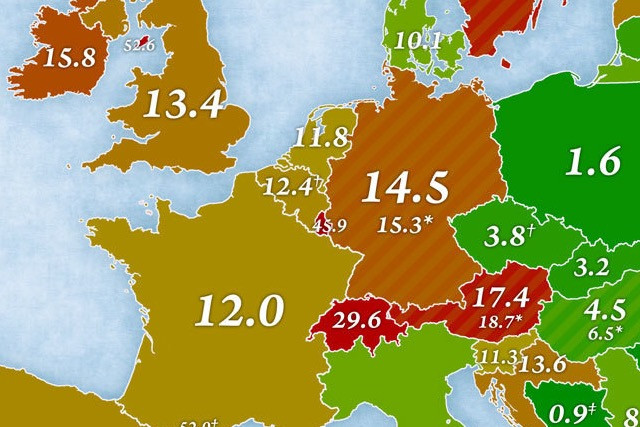
Marian, a Czech linguist, started with figures from a 2015 UN study issued in response to the migrant crisis in Europe.
He then produced four maps, published in July 2016, that combine the UN data with Eurostat figures on the number of asylum seekers between January 2015 and June 2016, minus the number of rejected applicants.
Marian characterised “immigrants” as people residing in a certain country but who were not born “within the current borders of that country”.
The maps presented migration in Europe in four categories:
- the percentage of immigrant population
- most common country of origin of foreign-born population
- percentage point change in immigrant population between 2010 and 2015
- most expanding immigrant population between 2010 and 2015
With 45.9%, Luxembourg clearly scored the highest number in Europe, followed by Switzerland (29.6%), Sweden (18.5%) and Austria (17.4%). In the UK, 13.4% of the population were counted as foreign-born.
In Luxembourg, the majority of immigrants were Portuguese. In the grand duchy’s neighbouring country France, the majority of foreign-borns were Algerian; in Belgium the majority was Italian; and in Germany, it was Polish.
According to the third map, Luxembourg also saw the highest increase in immigrant populations with a percentage point of +13.4, followed by Norway (+3.6), Switzerland (+2.9) and Belgium (+2.7). The map also showed how Sweden has been affected by the European migration crisis, where the number of asylum seekers has risen from +2.1 to +3.7.
The fourth map showed that Portugal remained the most expanding immigrant group between 2010 and 2015 in Luxembourg. In Sweden, Germany, Denmark and Hungary the migration crisis impacted the identity of immigrants, where the Syrian population expanded.
According to the last map issued by Marian, immigration decreased in certain countries, including Greece, Poland and Serbia.


